Kouncil: Algorithm Reference
Overview
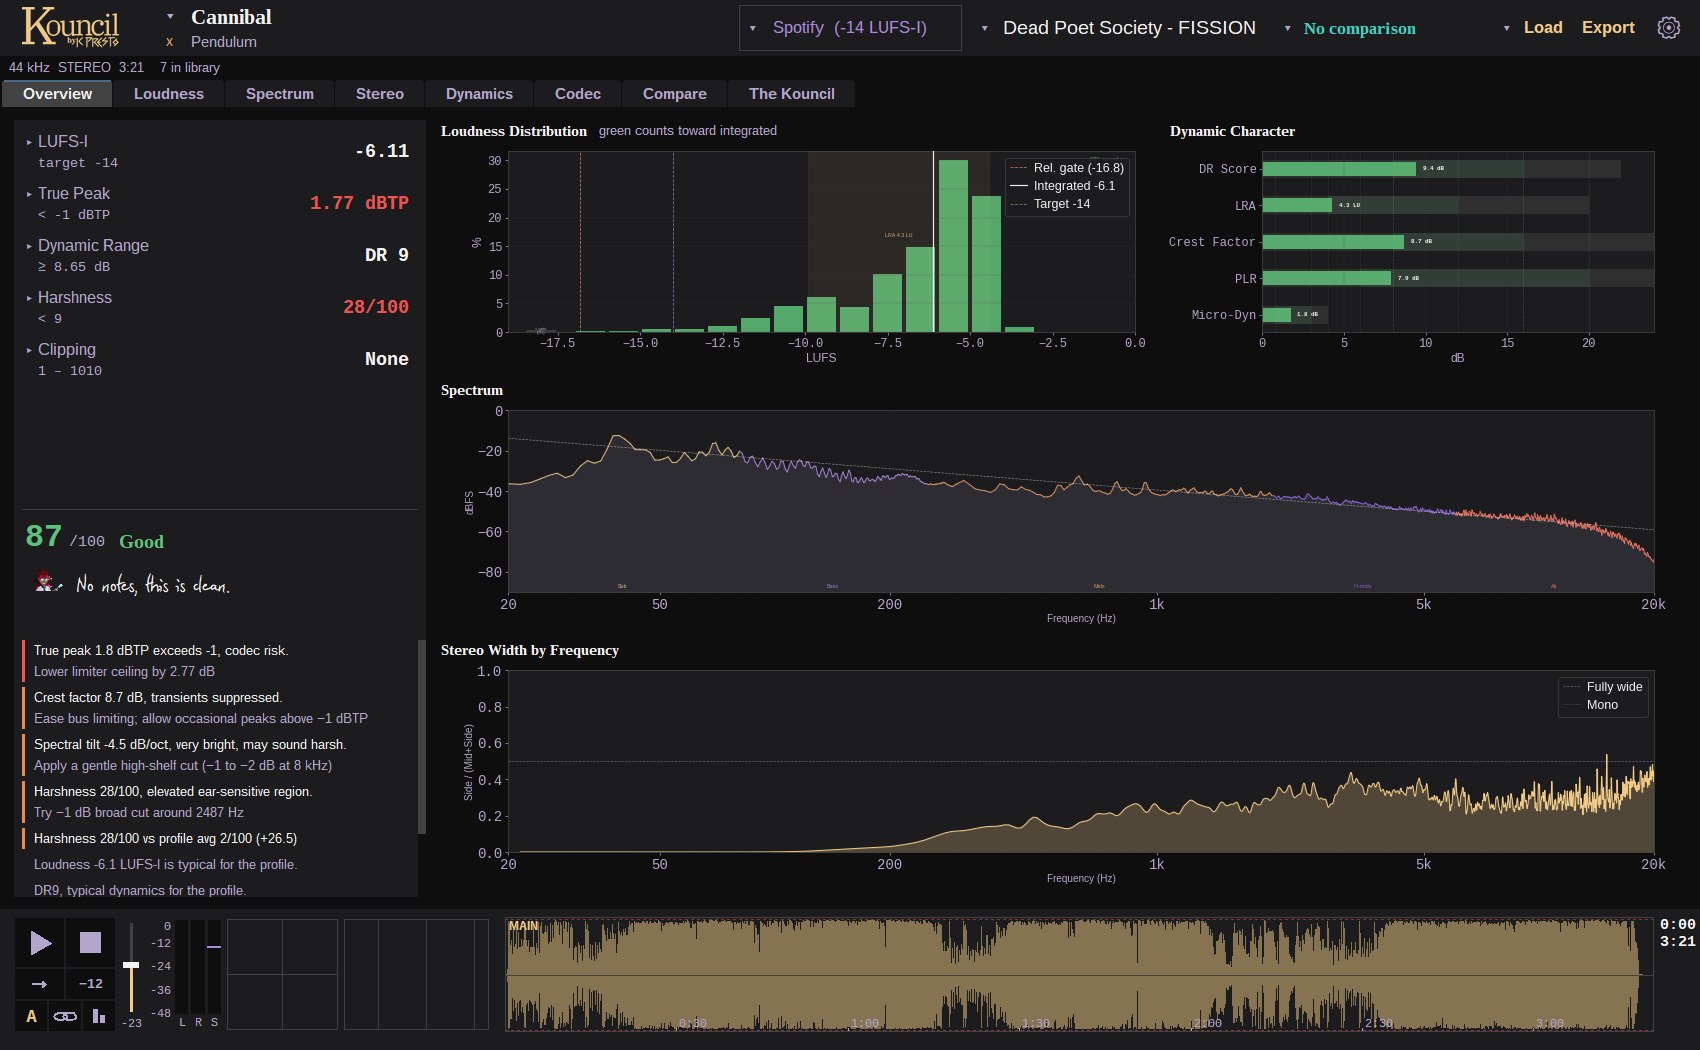
Kouncil is a desktop mastering analyzer written in Python (NumPy, SciPy, Matplotlib, Tkinter, ffmpeg). This post lists every measurement it makes and how each one is computed. Window sizes, thresholds and formulas are the ones in the code.
Thresholds that decide whether a value is flagged were set from measured masters, not from rules of thumb: the reference library behind the genre profiles, 2,499 released tracks across 100 genres. Where this page gives a “typical” range, that is where it comes from.
Loudness
All loudness follows ITU-R BS.1770-4 / EBU R128, the measurement streaming services normalize to. It is tested against EBU Tech 3341 (a stereo 997 Hz sine at −23 dBFS reads −23.0 LUFS) and checked against ffmpeg’s ebur128 filter on real tracks.
K-Weighting
Two biquads per channel: a high shelf (1681.97 Hz, +4.0 dB, Q 0.7072) and a high-pass (38.135 Hz, Q 0.5003). The standard only publishes coefficients at 48 kHz, so Kouncil takes the analog prototypes behind them through the bilinear transform at the file’s own rate. That reproduces the published values exactly at 48 kHz and the same curve at 44.1, 96 or anything else. The weighted signal is computed once and shared by every loudness measure.
Integrated Loudness (LUFS-I)
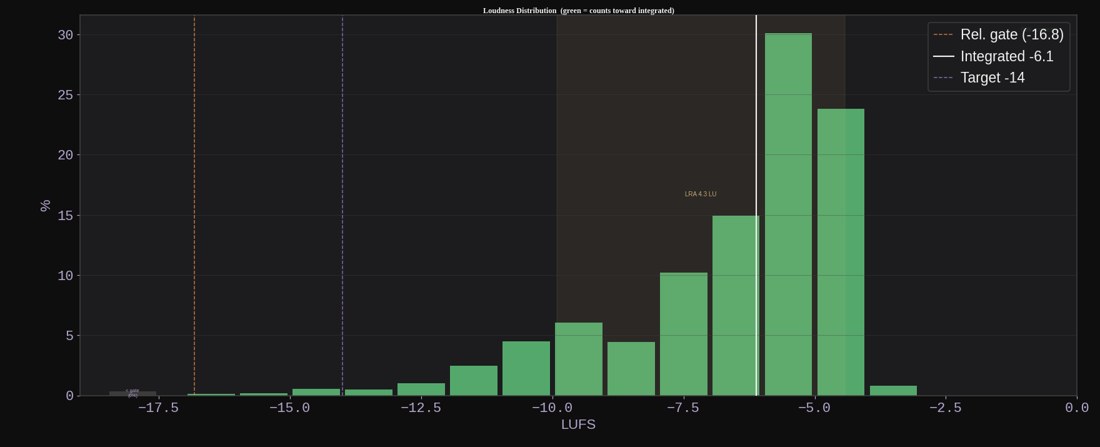
- 400 ms blocks, 100 ms hop
- Block power = mean square over time, summed over channels
- Absolute gate at −70 LUFS
- Relative gate 10 LU below the mean of what survived
LUFS = −0.691 + 10·log10(mean(gated blocks))
Short-term and Momentary
The same block power at 3 s / 1 s hop (short-term) and 400 ms / 100 ms hop (momentary), ungated, as time series. The momentary series also carries a gate flag per block (silent, audible but excluded, counted) for the loudness distribution chart.
Loudness Range (LRA)
Short-term values, absolute gate at −70 LUFS, relative gate 20 LU below the mean, then the 95th minus the 10th percentile.
Peak and Level
- RMS:
20·log10(sqrt(mean(mono²))), no weighting. - Sample peak:
20·log10(max|x|). - True peak (dBTP): 4x polyphase upsampling (
scipy.signal.resample_poly), then the maximum. Catches the inter-sample peaks that sample peak misses and that a lossy decoder will reproduce. - Crest factor: peak dBFS minus RMS dBFS.
- DC offset: mean sample value as a percentage of full scale.
- Clipping: count of samples at or above ±0.9999.
Every level figure is measured on the file as delivered, before any analysis normalization is applied to the spectral and stereo stages.
Dynamic Range
- DR: mean over 3 s non-overlapping chunks of each chunk’s peak-to-RMS in dB.
- PLR: true peak minus integrated loudness. A direct read of how hard the limiter works.
- PSR: per 3 s block (1 s hop), peak minus short-term loudness, then the 90th percentile. This catches a single over-limited section that a whole-track PLR averages away.
Dynamics
These describe the shape of the dynamics rather than the level.
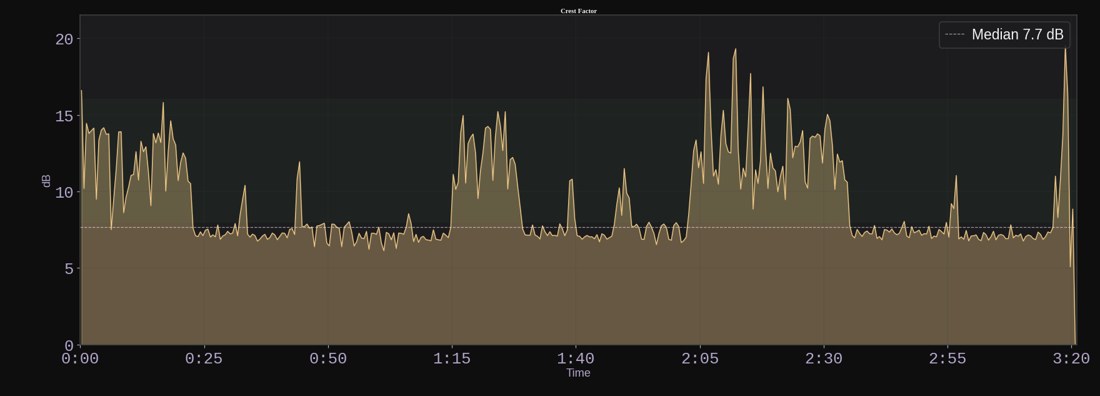
Crest Factor Timeline
Peak-to-RMS per 500 ms window, so you can see where transients survive and where they were flattened.
Band Dynamics
STFT (4096-point Hann, 50% overlap) summed into 7 bands from Sub to Air. Per band: crest as max minus mean of the band’s dB level, and micro-dynamics as the standard deviation of the frame-to-frame change. Shows which part of the spectrum lost its movement, which is what you tune a multiband limiter against.
Micro-Dynamics
RMS envelope in 50 ms hops, in dB, absolute difference between neighboring frames, smoothed with a 0.5 s rolling mean. A low average means short-term amplitude movement (articulation, groove) has been limited out.
Transient Profile and Density
Positive spectral flux on a 2048-point STFT (hop 1024): flux = Σ max(0, |X[n]| − |X[n−1]|), normalized to its maximum. Peaks above 0.3 are onsets, and onsets per second is the transient density.
Attack Slopes
For each onset (deduplicated within 50 ms), a 2 ms-hop RMS envelope over a 20 ms window (5 ms before, 15 ms after), and slope = (max dB − min dB) / window ms. The median is reported in dB/ms. Two tracks can have the same crest factor and very different attacks; this tells them apart.
Section Contrast
K-weighted loudness of 8 s sections, silence below −60 LUFS dropped, then P95 minus P5. The verse-to-chorus arc in one number.
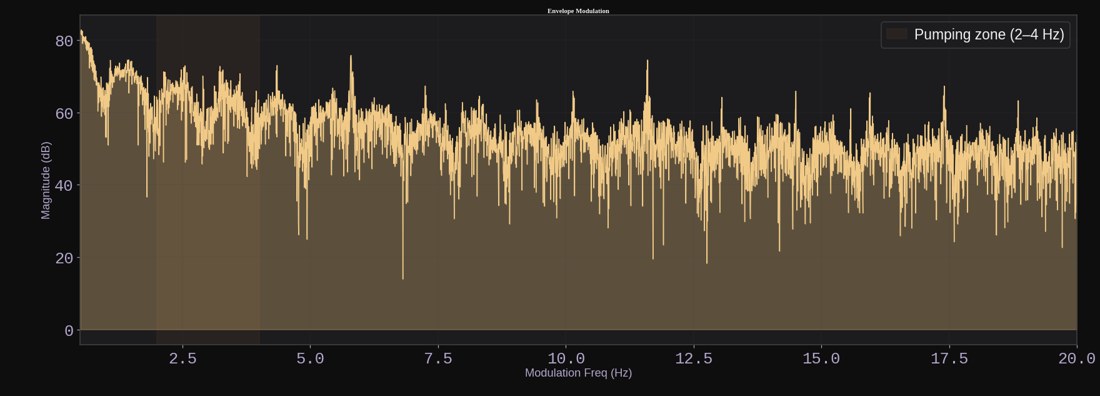
Envelope Modulation Spectrum
RMS envelope at 10 ms hops, in dB, mean removed, then an FFT of the envelope itself, kept over 0.5 to 20 Hz. A flat result means the limiter took the movement out. A narrow peak at 2 to 4 Hz is usually a compressor pumping on the kick. Modulation depth is the standard deviation of this spectrum.
Spectral
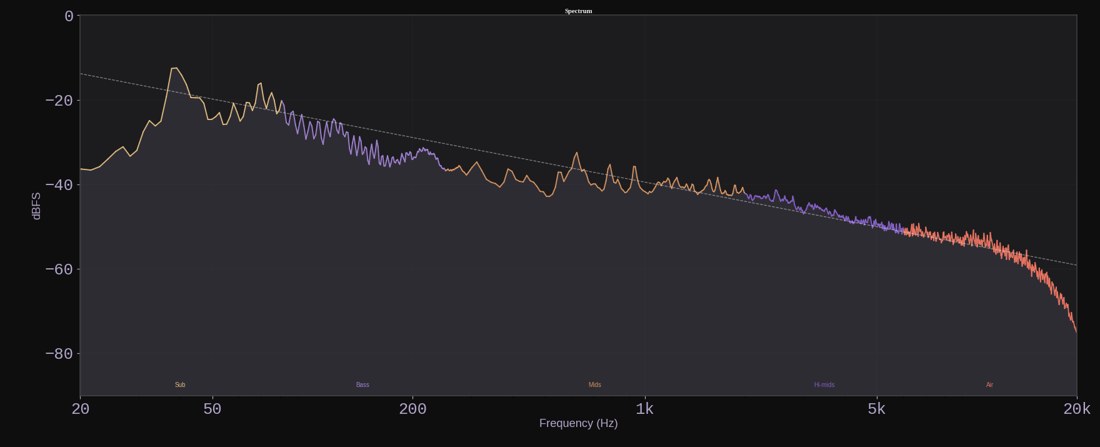
Average Spectrum
Mono, 4096-point Hann FFT, 50% overlap, power averaged over all frames and normalized by FFT size. 10.8 Hz bins are too coarse for the low end, so below a join frequency the curve comes from a 32768-point FFT of the same signal (1.35 Hz bins instead of 10.8) and is crossfaded into the coarse one. Both are density-matched, so broadband content sits at the same level in each.
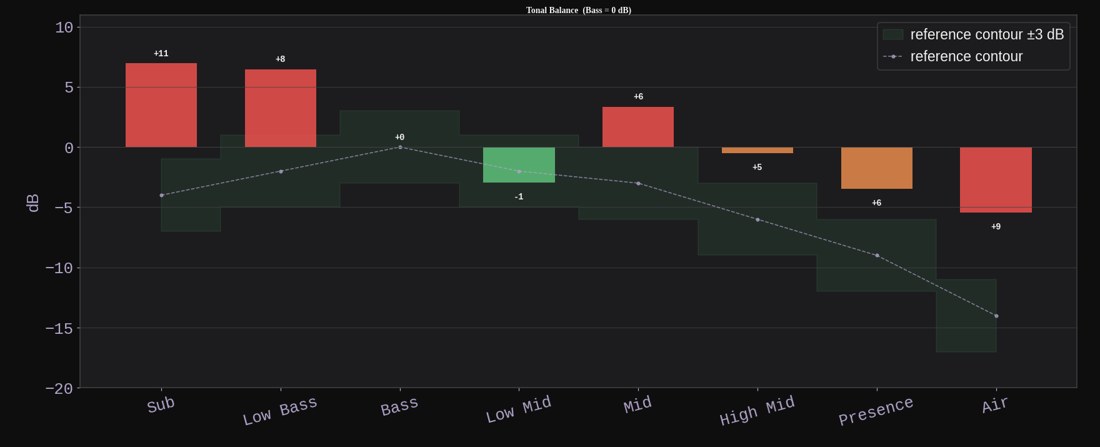
Tonal Balance
8192-point FFT, power summed into 8 mastering bands, in dB, normalized so the Bass band (120 to 250 Hz) is 0 dB. Compared against the active profile’s range for each band.
Spectral Tilt
Least-squares fit of dB = slope·log2(f) + b over 100 Hz to 16 kHz, in dB/octave. Pink noise is −3. The fitted line is drawn over the spectrum.
Resonance Detection
- Up to 200 frames of 8192-point spectra across the track, 60 Hz to 18 kHz
- Each frame against its own baseline: a running median one octave wide on a log-frequency grid, so the window is the same musical width at 100 Hz as at 10 kHz
- Prominence per frame = frame minus baseline, then the median over frames
- Peaks above 7 dB
- Drop a peak that is line narrow and part of a harmonic series with two or more peaks of similar strength
- Top 10
Step 3 is what makes this usable on music. A resonance (an EQ boost, a room mode, a ringing drum) raises its frequency in every frame. A note’s partials stand up only while the note plays, so the median over time removes them. Step 5 catches the notes that sound most of the track, like a pad on the key center: their partials are spectral lines in a harmonic series, and a resonance is a lone bell.
The prominence isn’t weighted by hearing sensitivity, so it reads close to the boost’s own gain in dB. Tested by multiplying peaking-EQ boosts into the spectra of the reference library’s tracks, a +12 dB boost is found 81% of the time, and 87 to 100% of the time from 2 kHz up, at about 0.8 false reports per released master.
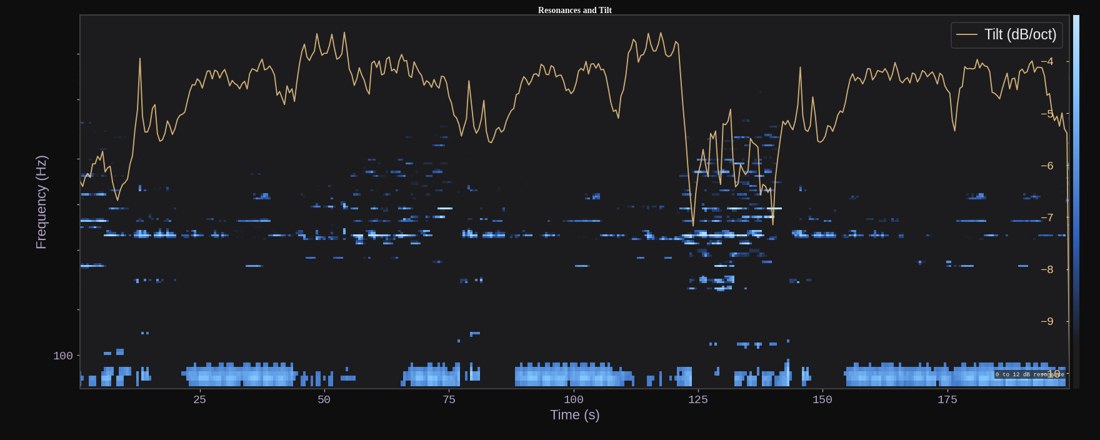
Resonance Map
The same detection per 2 s window (0.5 s hop) with a hard 6 dB gate, plus the tilt per window. Drawn as a frequency-by-time heatmap with the tilt line over it, so a resonance can be found in the arrangement, not just in the average.
Perceptual
Sensitivity Curve
An A-weighting approximation of the equal-loudness contours:
Ra(f) = 12194²·f⁴ / ((f² + 20.6²)·sqrt((f² + 107.7²)(f² + 737.9²))·(f² + 12194²))
weight_dB = 20·log10(Ra(f) / Ra(1 kHz))
For the resonance map it becomes a multiplier, 1 + clip(weight_dB, −10, 10)·0.05. For listening-level comparisons the curve is scaled by (85 − SPL) / 45, since the contours flatten as playback gets louder.
Harshness
Weighted power in 2 to 5 kHz over weighted power in 80 Hz to 16 kHz, mapped from its typical range (0.12 to 0.45) onto 0 to 100. Tilt is broadband; this targets the band where the ear canal adds about 6 dB of its own.
Low-Volume Translation
The average spectrum weighted at 85 dB SPL and at 65 dB SPL, each normalized to its own mean, and score = 100 − 12.5·RMS(difference). A mix that depends on sub and air drops out at low volume and scores low.
Perceptual Dynamic Range
Weighted level per 3 s chunk (FFT, weighted, summed), silence dropped, P95 minus P5. A track whose dynamics all live in the sub reads as DR8 but sounds flat; this number agrees with the ear.
Stereo
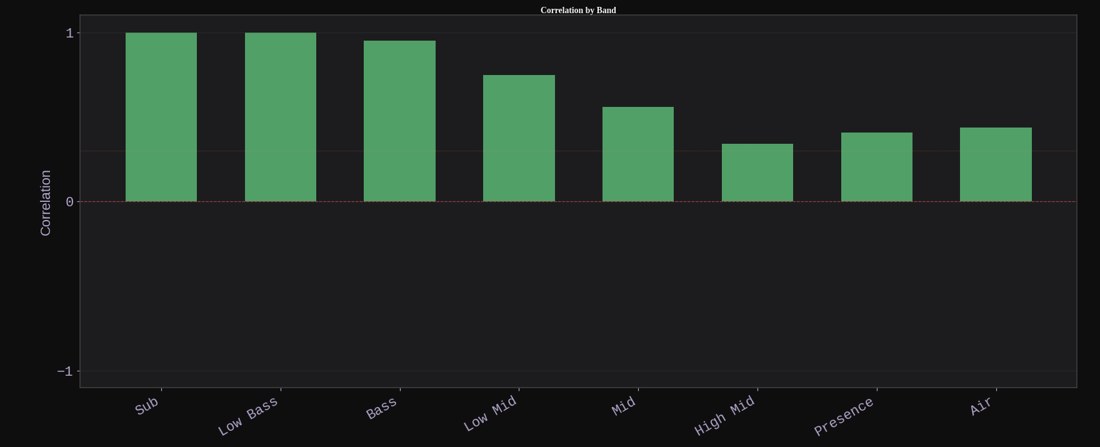
- Correlation: Pearson correlation of L and R, whole track and per 500 ms window.
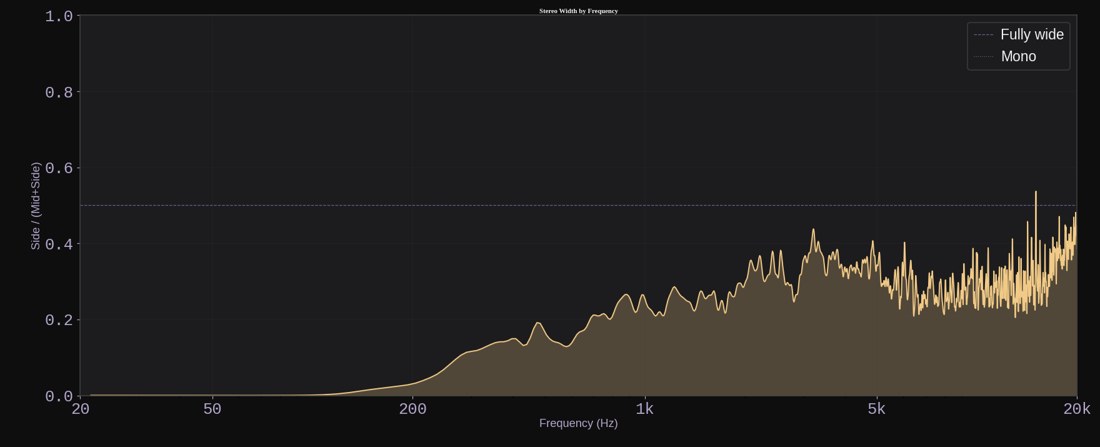
- Width by frequency:
S² / (M² + S²)per FFT bin withM = (L+R)/2,S = (L−R)/2. 0 is mono, 0.5 fully decorrelated, above 0.5 anti-phase. - Width heatmap: the same ratio per STFT frame (2048, 0.5 s hop, up to 16 kHz).
- Mono compatibility:
20·log10(RMS(mono) / RMS(stereo))for the full band and below 120 Hz. - Mid/Side spectrum: separate average spectra of M and S, with the same low-end join as the main spectrum. Where S exceeds M is filled as a warning.
- L/R balance by band:
10·log10(ΣL²) − 10·log10(ΣR²)per tonal band, on a fixed ±6 dB axis so a 0.1 dB difference doesn’t look like a hard pan. - Phase correlation by band:
Σ Re(L·conj(R)) / sqrt(Σ|L|²·Σ|R|²), the frequency-domain Pearson correlation per band. - M/S level: RMS of M and of S in dBFS and their difference.
- Goniometer: about 6,000 points of
SagainstM(both scaled by 0.7071).
Codec Simulation
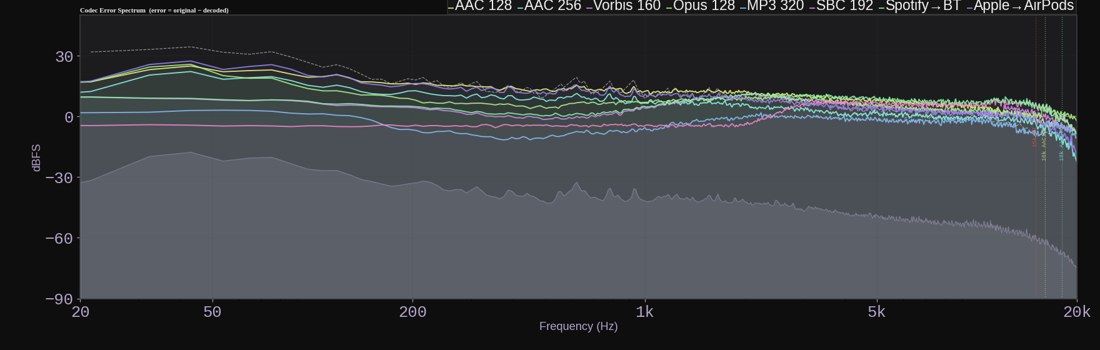
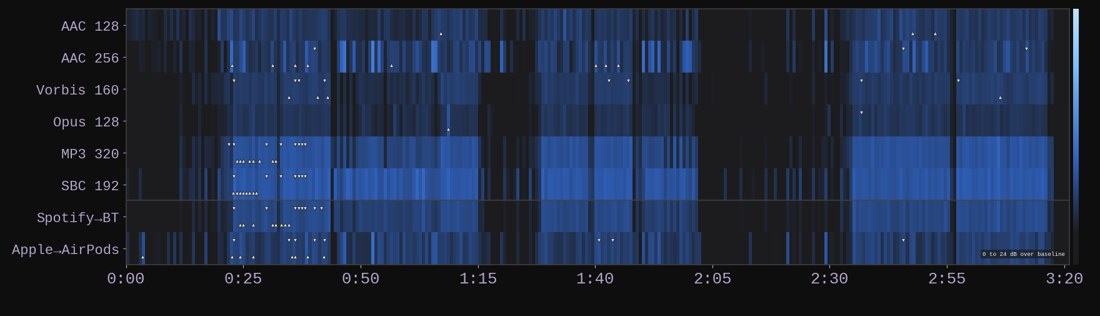
Rather than model codec damage, Kouncil runs the track through real encode and decode round-trips with a bundled ffmpeg and measures the difference.
| Version | Stands in for |
|---|---|
| AAC 128 | web players, free tiers |
| AAC 256 | Apple Music, YouTube Music, Spotify Premium |
| Vorbis 160 | Spotify’s apps at normal quality |
| Opus 128 | YouTube, Discord |
| MP3 320 | SoundCloud, downloads, CDJs |
| SBC 192 | baseline Bluetooth |
| Vorbis 160 → SBC 192 | Spotify over Bluetooth |
| AAC 256 → AAC 256 | streaming AAC re-encoded for AirPods |
Chains feed the decoded output of the first codec into the second and are measured against the original, so the error is the whole listener path.
Alignment
Every figure below is a difference, so the decoded audio has to line up with the source to the sample. The lag is found by cross-correlating a stretch from the middle of the track (time-delay estimation, as in sonar), then the decode is shifted. ffmpeg already strips the priming delay of AAC, MP3 and Opus; raw SBC comes back 73 samples late and short, which this catches.
Error Measurements
With error = original − decoded:
- Error spectrum: average power spectrum of the error against the original’s.
- Masking threshold: a simplified Moore-Glasberg spreading model. Frequencies to Bark, absolute threshold of hearing, and one masker per quarter Bark spread at +25 / −40 dB per Bark less 14 dB, computed as one broadcast
(n_freq, n_maskers)array. Error above the threshold is audible; error below it is masked. - Error timeline: error RMS per 16 ms frame. The top 5 frames are reported as timestamps.
- Pre- and post-echo: at each onset (flux above its 75th percentile), error RMS in 5 to 50 ms before and after, flagged when it is 6 dB over the track’s baseline error.
- True peak delta: dBTP of the decode minus dBTP of the original. Codecs raise peaks, which is why delivery specs ask for −1 dBTP and not 0.
- Transient fidelity: median ratio of decoded to original spectral flux at up to 30 onsets, as a percentage.
- Quiet noise floor: error RMS in 100 ms segments at least 10 dB below the track’s median level.
- Stereo collapse:
20·log10(RMS(error side) / RMS(error mid)). - Spectral centroid shift: per-frame centroid of the decode minus the original’s, in Hz.
- Stereo width shift: change in
S² / (M² + S²)per 500 ms window, with the worst moment’s time. - Block artifacts: autocorrelation of the error timeline (median removed) at exactly the AAC and MP3 frame lengths, 1024 and 1152 samples. Above 2.0 the error repeats at the frame period, and frames 3 dB over the median at that spacing are reported.
Consistency
For each of six figures a master can actually change (transient fidelity, stereo collapse, true peak delta, noise floor, centroid shift, width shift), the spread across the six single codecs scored as 100·(1 − spread / reference range), averaged into one 0 to 100 score. How much top end a codec keeps is not in it: that is the codec’s bandwidth, the same for every master.
Render QC
Checks for mistakes in the bounce itself rather than in the master.
- Sample rate and bit depth: under 44.1 kHz, non-standard rates, 8-bit, and lossy sources are flagged. Bit depth is read from the WAV header before decoding.
- Head and tail silence: from 20 ms RMS frames against −60 dBFS.
- Premature cutoff: the last 200 ms is loud (above −30 dBFS) and the final 20 ms is 25 dB quieter than it. A fade drops gradually; a cut doesn’t.
- Render glitches: the marks a buffer underrun leaves, matched bit for bit in every channel. A hold (every channel keeps one value for 32 samples or more, shorter than a dropout) or a repeat (a stretch of 32 to 8192 samples, a power of two, equal to the stretch before it). Each needs audible audio on both sides and a jump into or out of it, because music holds exact values too (silence before the first note, a hard gate, a clipped top) but reaches them smoothly. Holds at the track’s clipped level don’t count. A lossy file is reported as not checked.
- Dropouts: runs of 20 ms frames under −60 dBFS lasting 50 to 500 ms, with audio above −40 dBFS for 500 ms on both sides.
- DC spike: a 1 s block whose mean departs from the track’s mean by more than 0.03.
Methods From Outside Audio
A few of these came from other fields where the problem turned out to be the same one.
- Resonance detection is spectroscopy’s baseline subtraction (a running median under narrow lines) with prominence from topography. What it needed on top was a way to tell a resonance from a note: a resonance belongs to the channel and is in every frame, a note belongs to the signal and comes and goes, so the prominence kept is the median over time.
- Profiles are reference intervals, the way a lab’s “normal range” is the central span of a healthy population. Ranges come from robust statistics: median, 10% trimmed mean, percentiles and Tukey fences, so one odd record can’t stretch a genre’s range.
- Block artifact detection is a blocking metric from image and video compression, in one dimension.
- The envelope modulation spectrum borrows the modulation transfer function behind the Speech Transmission Index (Houtgast and Steeneken), applied to a limiter instead of a room.
- Codec alignment is time-delay estimation from sonar.
- Timeline downsampling is min-max decimation, as a digital oscilloscope draws: each bucket keeps its minimum and maximum, so a one-frame spike survives any zoom.
Performance
- Shared intermediates: the K-weighted signal, mono mixdown, 50 ms RMS envelope, spectral flux and the 4096 and 8192-point average spectra are each computed once and passed to everything that needs them.
-
Vectorized STFT: frames come from a strided index matrix and one
rfft(axis=1)call, not a loop.idx = np.arange(n_fft)[None, :] + (np.arange(n_frames) * hop)[:, None] spectra = np.fft.rfft(signal[idx] * window, axis=1) - Matrix Pearson correlation over all windows at once instead of a
corrcoefper window. - Resonance map post-processing is one
median_filterover the whole frame-by-bin array and one matrix multiply against the regression pseudo-inverse for every frame’s tilt. - Batched windowed power caps each batch at 50 million elements so long files don’t exhaust memory.
- Parallel stages: a track’s heavy stages run side by side on a worker pool, and batch analysis admits a new track only while enough RAM is actually free, measured live rather than estimated.
- Playback in its own process: audio output runs in its own process with shared-memory sources, so analysis and chart drawing never hold up the audio callback.
- Snapshots store metrics and every visualization array in a versioned zip (
.ksnap, NumPy compressed), migrated forward on load, so nothing is ever re-analyzed to be viewed again.
Related Posts
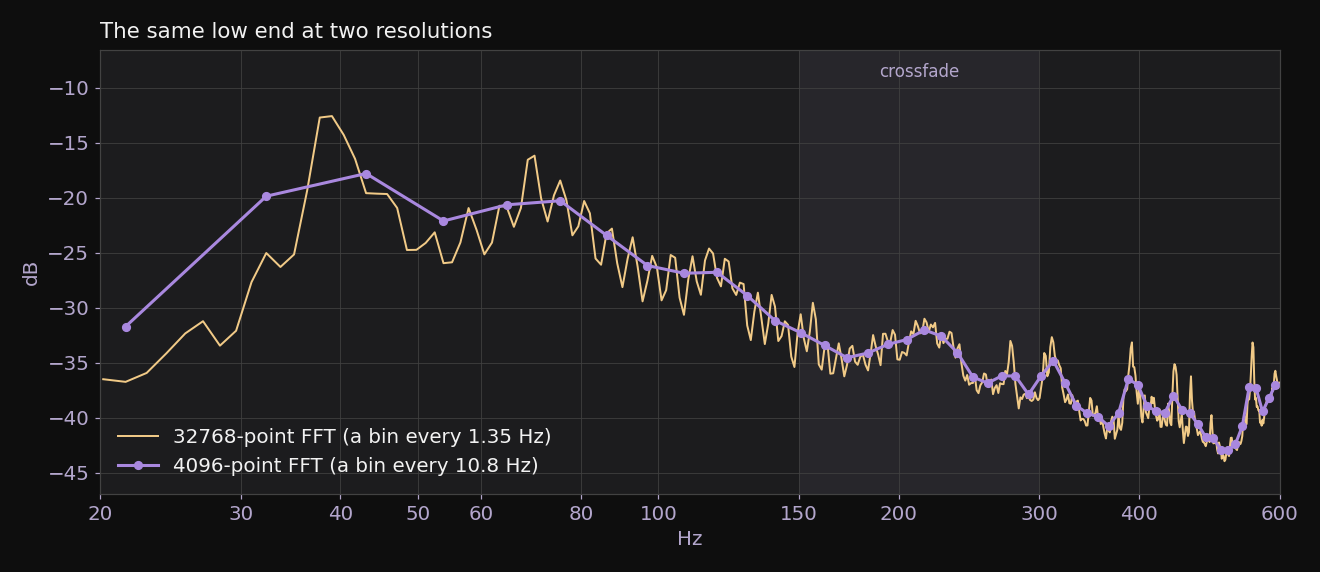
Kouncil: Optimizing Resolution with Split FFTs
Why Kouncil's spectrum draws its low end from a second, eight times longer FFT, and the 9 dB correction that makes the two meet.
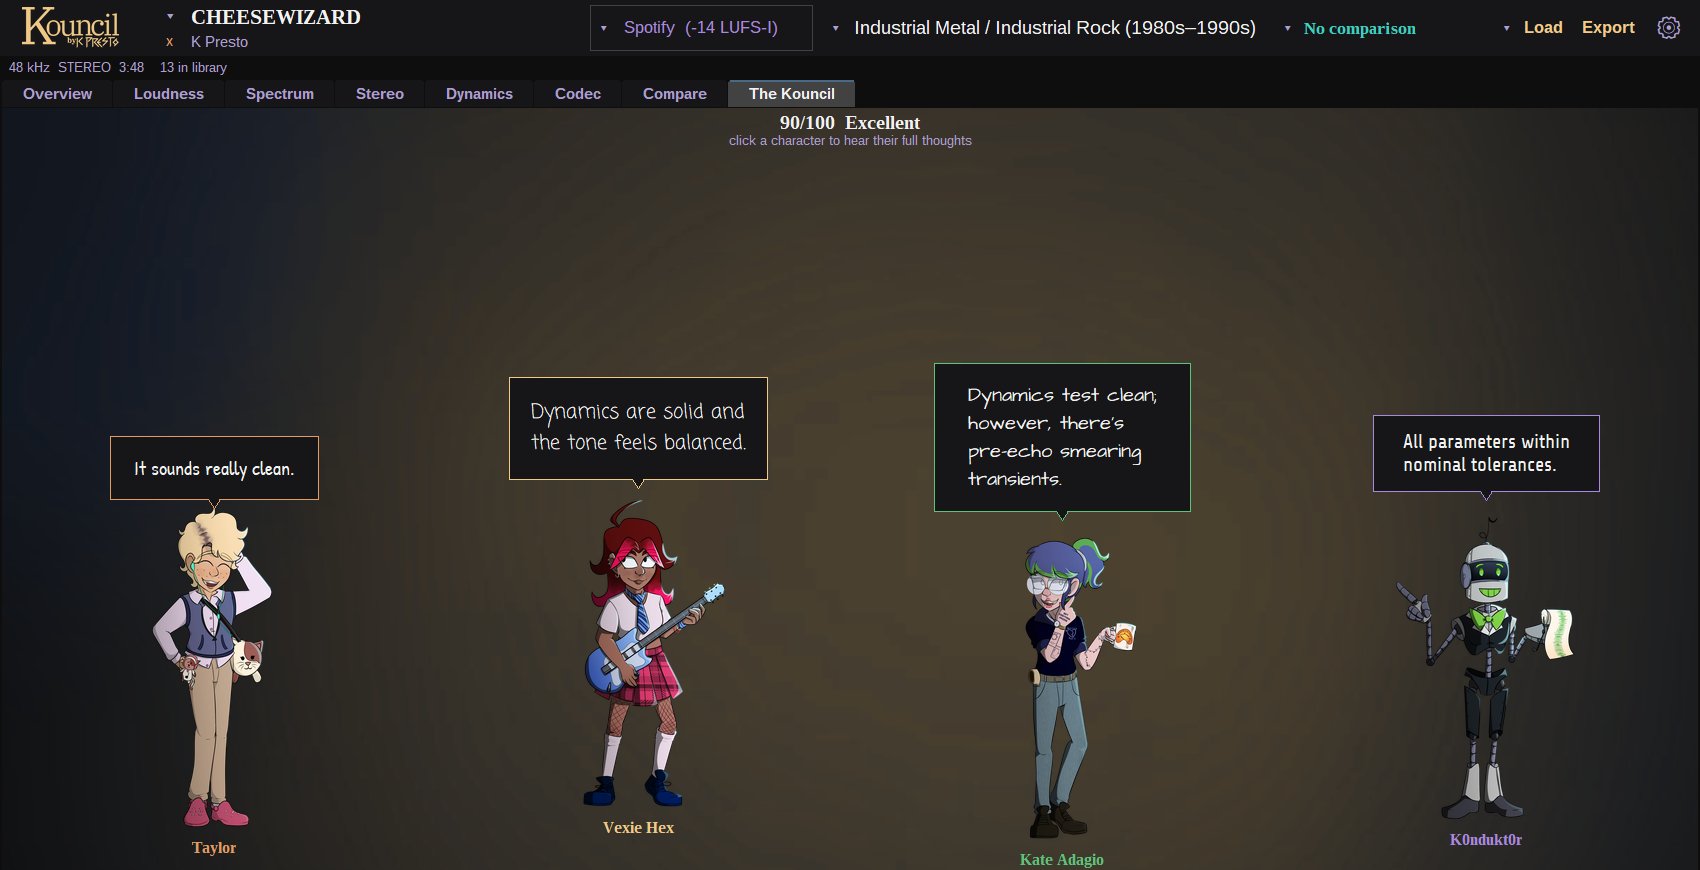
Kouncil: The Kouncil Members
Kouncil's data-driven music feedback dialogue system.
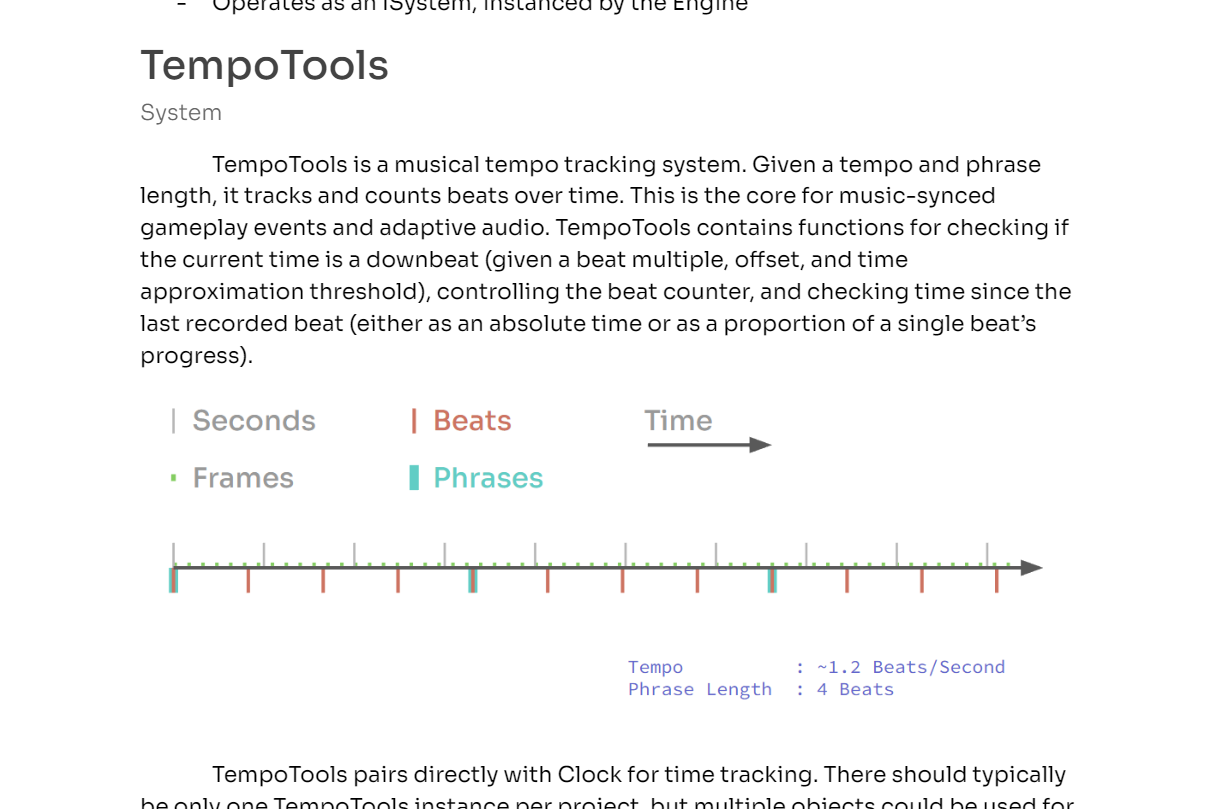
Inline: Out of Time - Adaptive Soundtrack System Overview
Architecture breakdown of Inline: Out of Time's gameplay-driven adaptive soundtrack system.
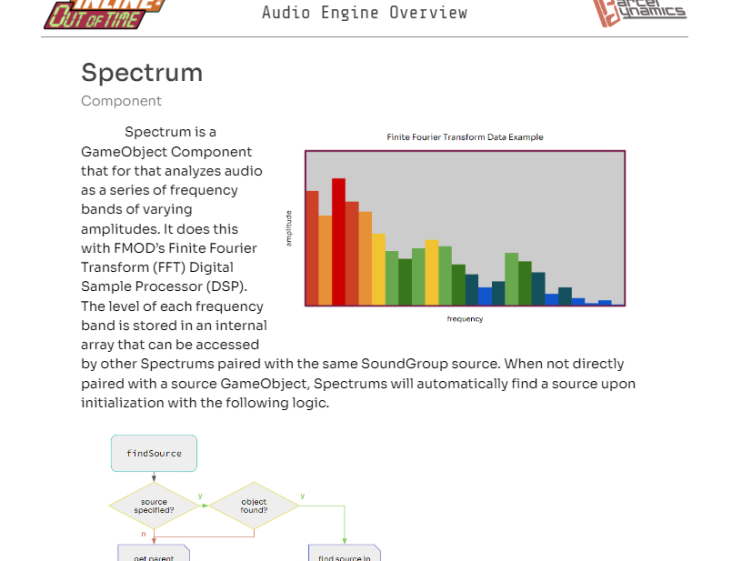
Inline: Out of Time - Audio Engine Overview
An overview of the powerful audio engine behind Inline: Out of Time's rich soundscape and audio-driven visuals.